

Percent of Change Task Cards Activity
Percent of Change Task Cards Activity
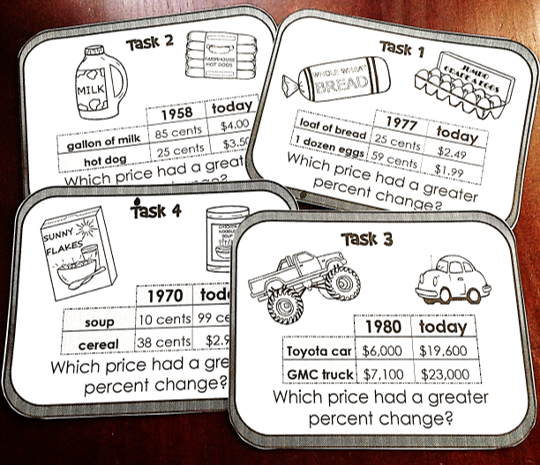
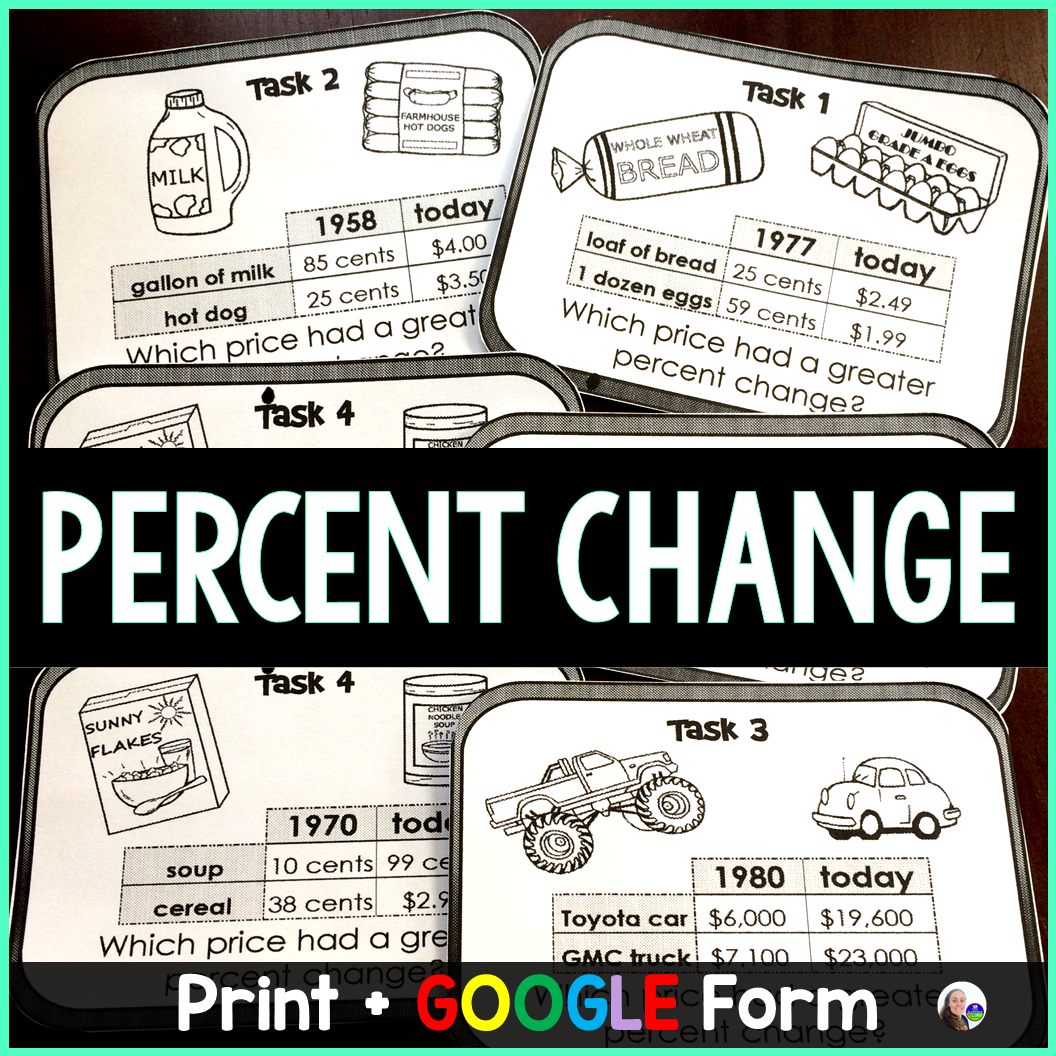
Students calculate and compare percent change between present and past costs of items in this financial literacy activity. Students then determine which item's cost increased the most over the years.
Students compare prices of food, cars, homes, salaries and other items from what they cost in past decades to what they cost today. Prices are historically accurate, which brings up good discussion about inflation and the cost of living.
What's included: 16 task cards, student answer sheet, and answer key. Includes both a PDF printable version and digital in Google Forms.
Couldn't load pickup availability

-
Digital download delivered instantly to your inbox
This was a great resource that met the standard. My students enjoyed it.
Engaging for students. Great resource of real-world problems.
I love this for my 7th graders. They were very engaged and loved this activity!
This resource was absolutely amazing for my 12:1:1 special ed math class. The kids were able to successfully accomplish the math skill objectives and had fun too!
This was a great resource for my senior level ACT/College Algebra prep course, as well as my 11th grade Technical Math course. Very engaging and a great review and practice of our material.